For the past few months, I have been working through Coursera’s Professional Data Science Certification. As part of the final Applied Data Science Capstone project, I studied thousands of car accidents in Seattle to determine if I could reliably predict the severity of a car accident under certain conditions.
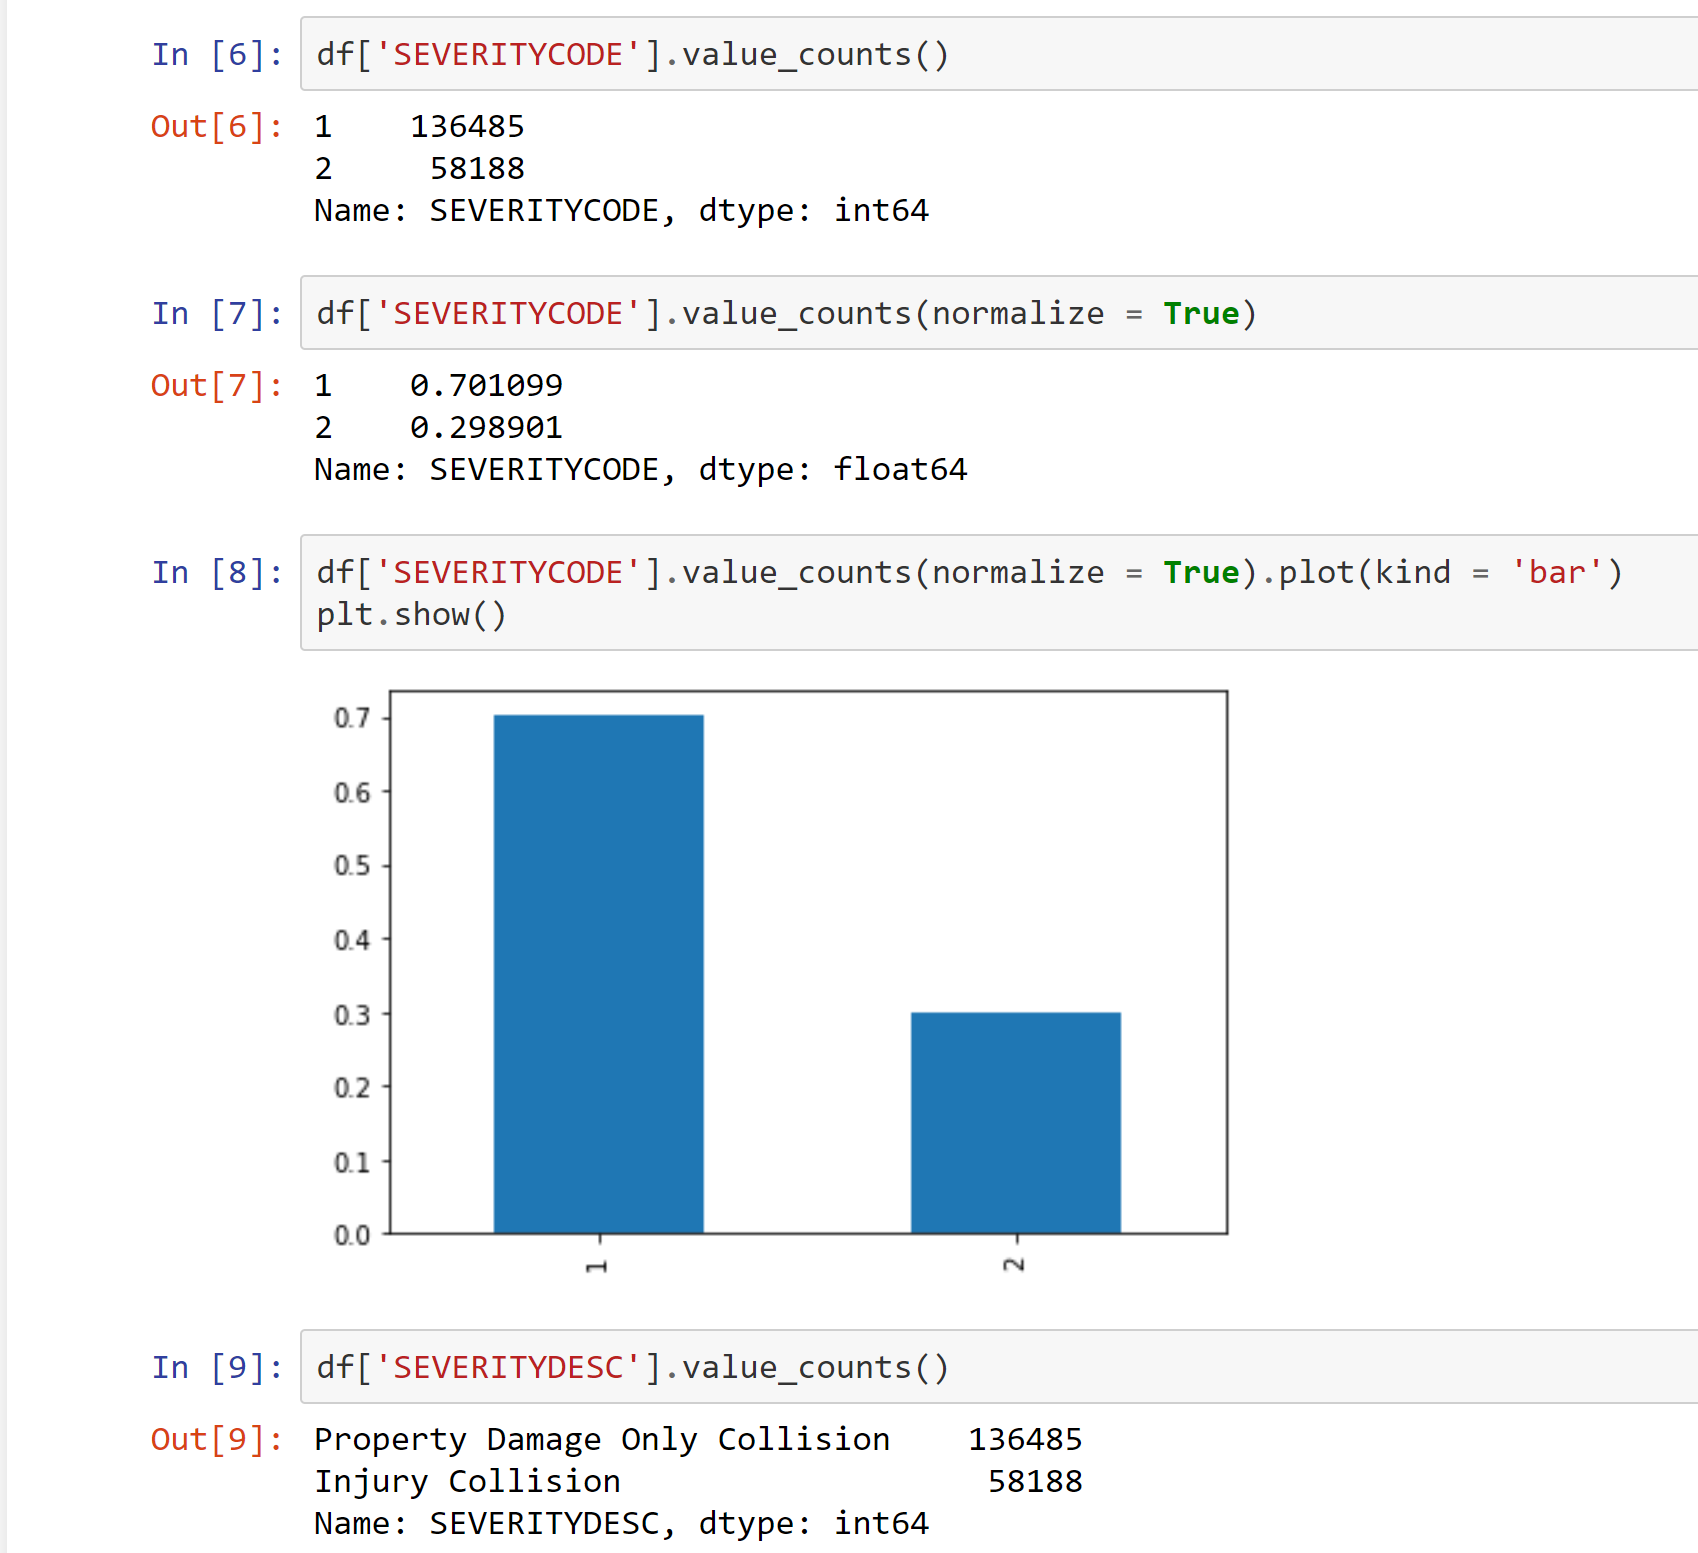
After importing all of the Python libraries I needed and reading the CSV data into a pandas dataframe, I began the data analysis by checking the value counts and percentages of the severity codes. I also confirmed that the severity description amounts matched the severity codes.
There were multiple columns with data about accidents that occurred. As I was focusing on the predictive value of the data, I selected columns that could be known before an accident occurred - LIGHTCOND, WEATHER, and ROADCOND. While examining the data, it was clear that accidents involving speeding, under the influence, and even address types (Alley, Block, Intersection) could all have substantial impacts on the severity of an accident, none of those could be known until AFTER an accident occurred. Therefore, their predictive values were severely limited.
As the goal was to predict the severity, I settled for the data points that could potentially be known before the accident occurs. For example, if road conditions are dry and the weather is overcast, you can potentially use that to predict the likelihood or severity of an accident.
Visualizing the data helps to see if there are any trends.
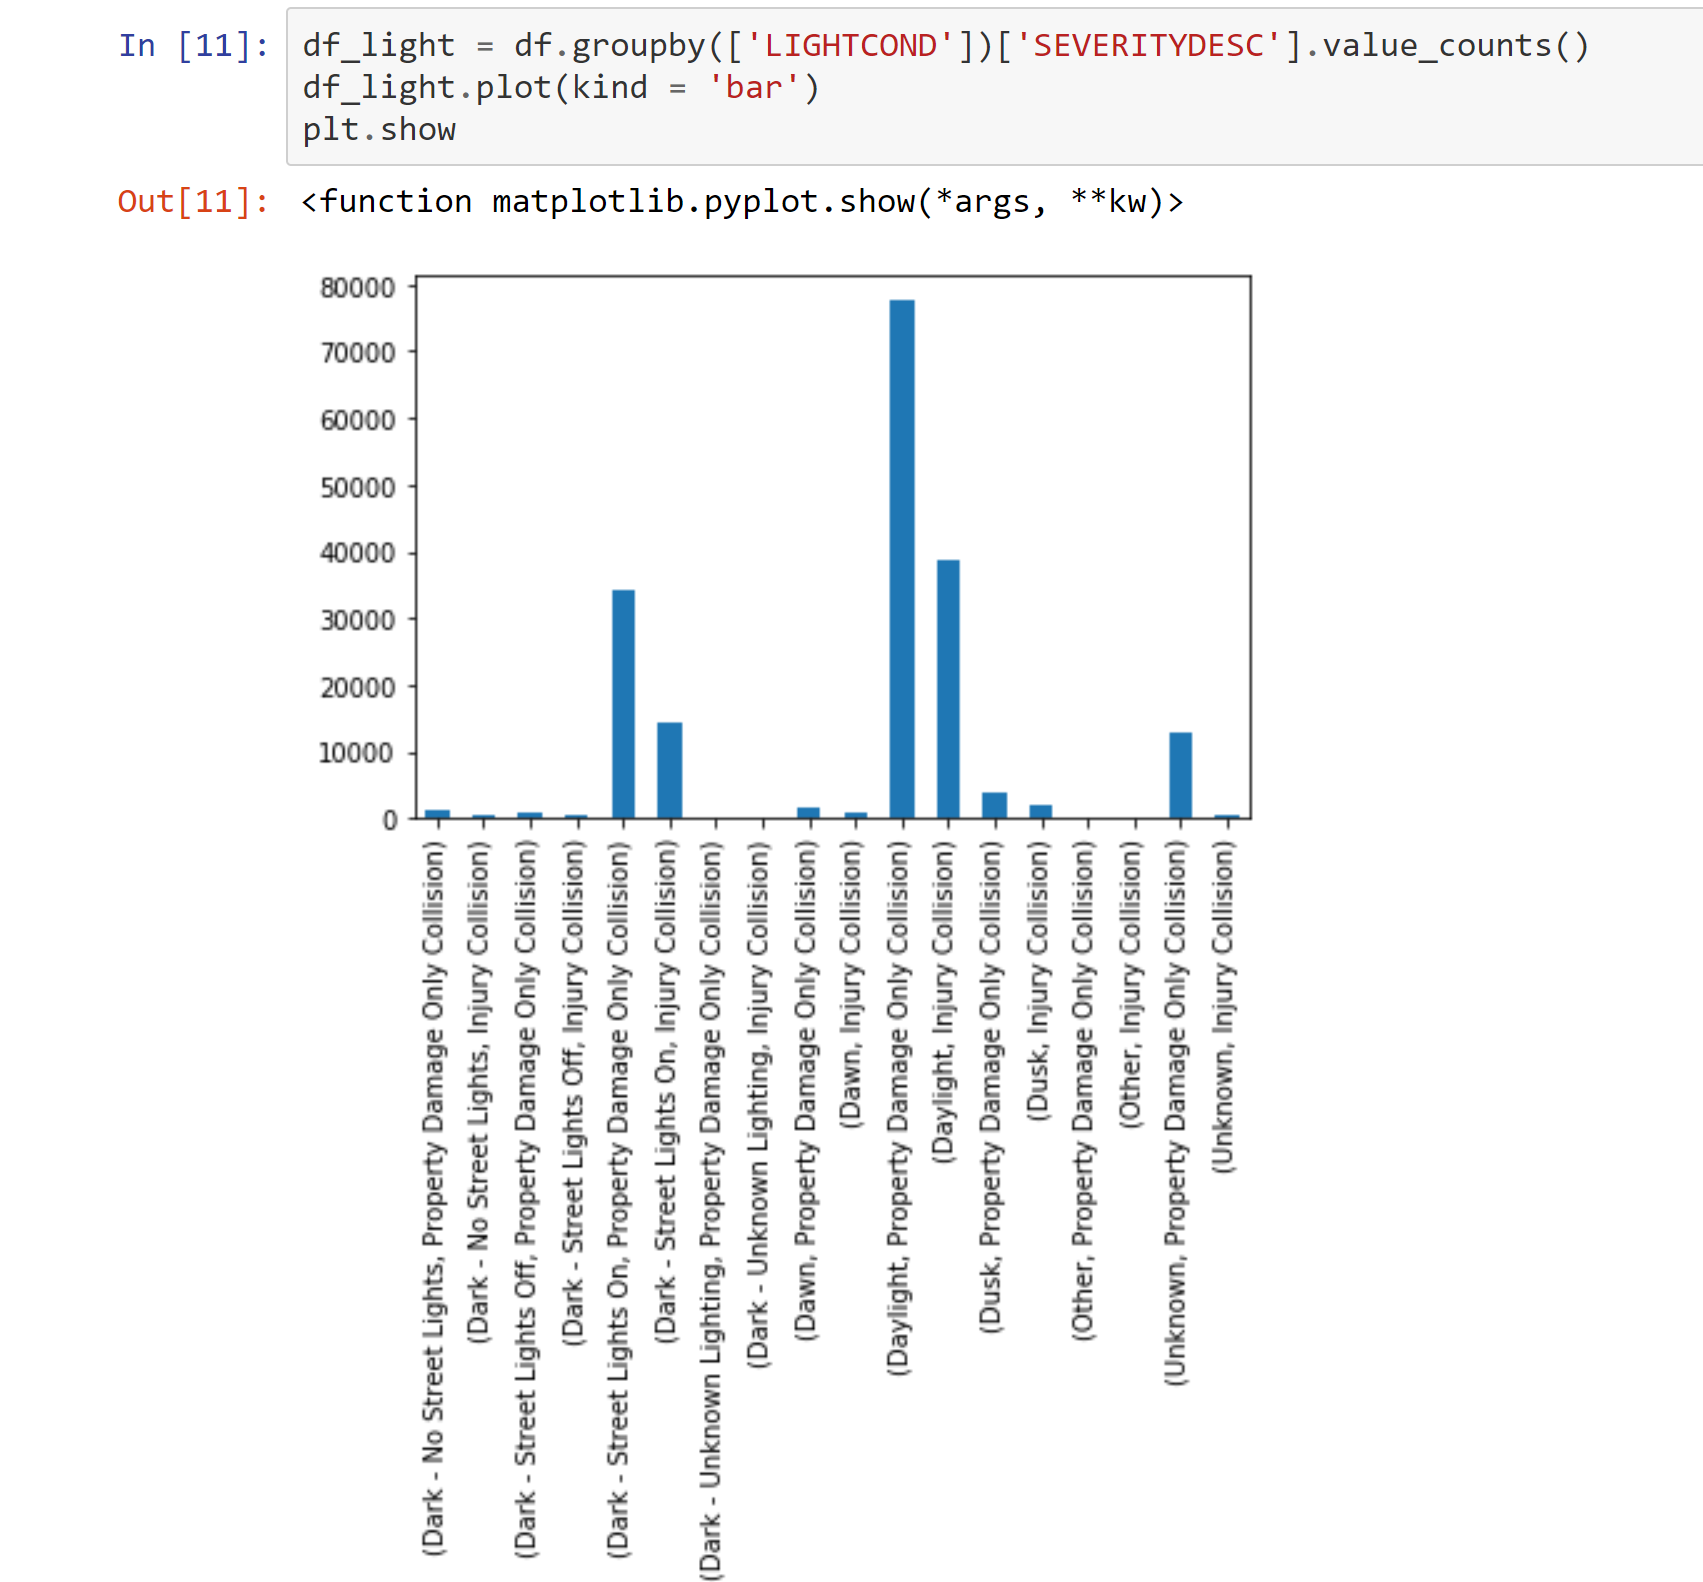
Light conditions grouped by collision type
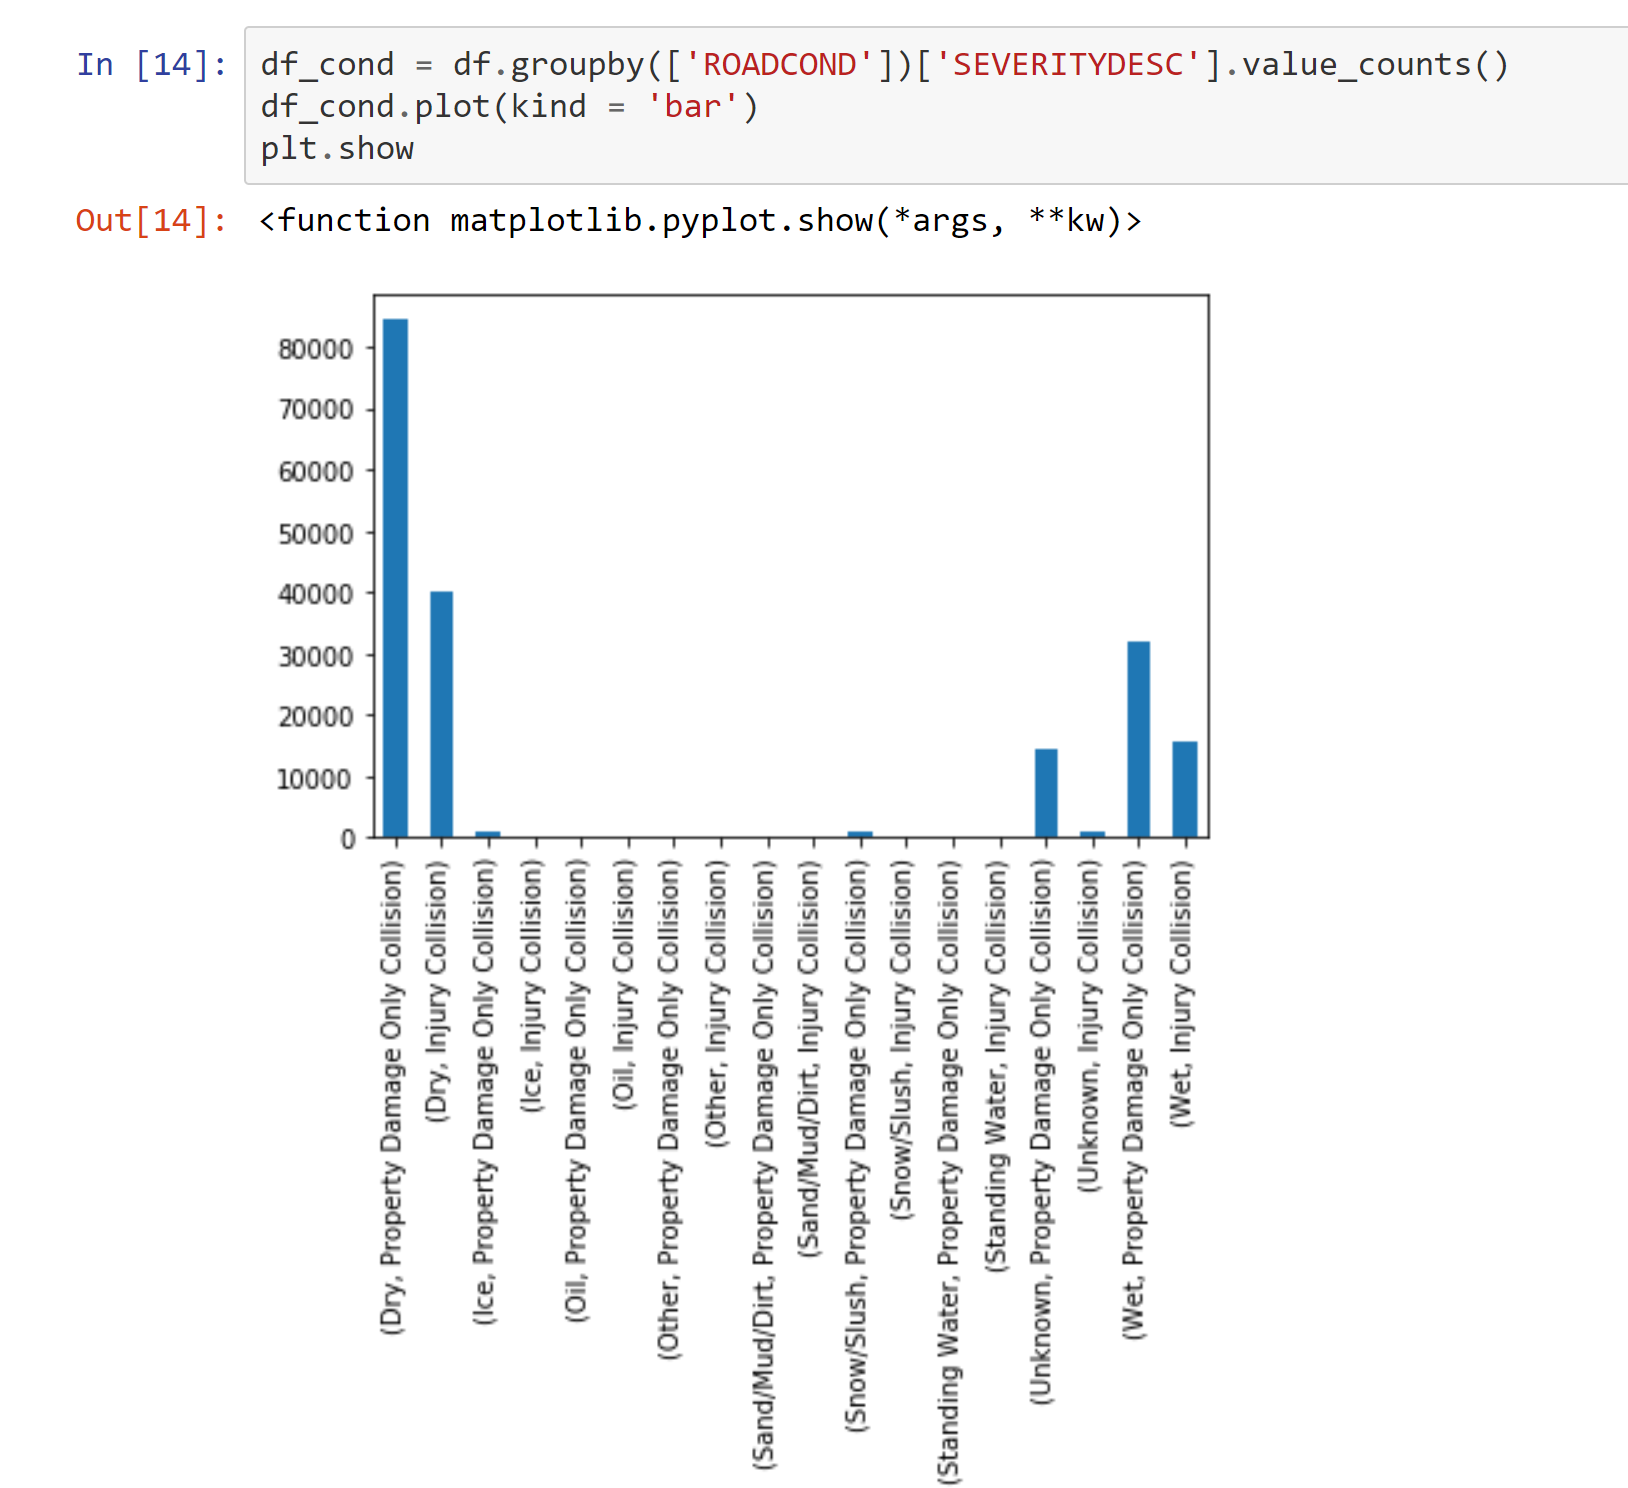
Road conditions grouped by collision type
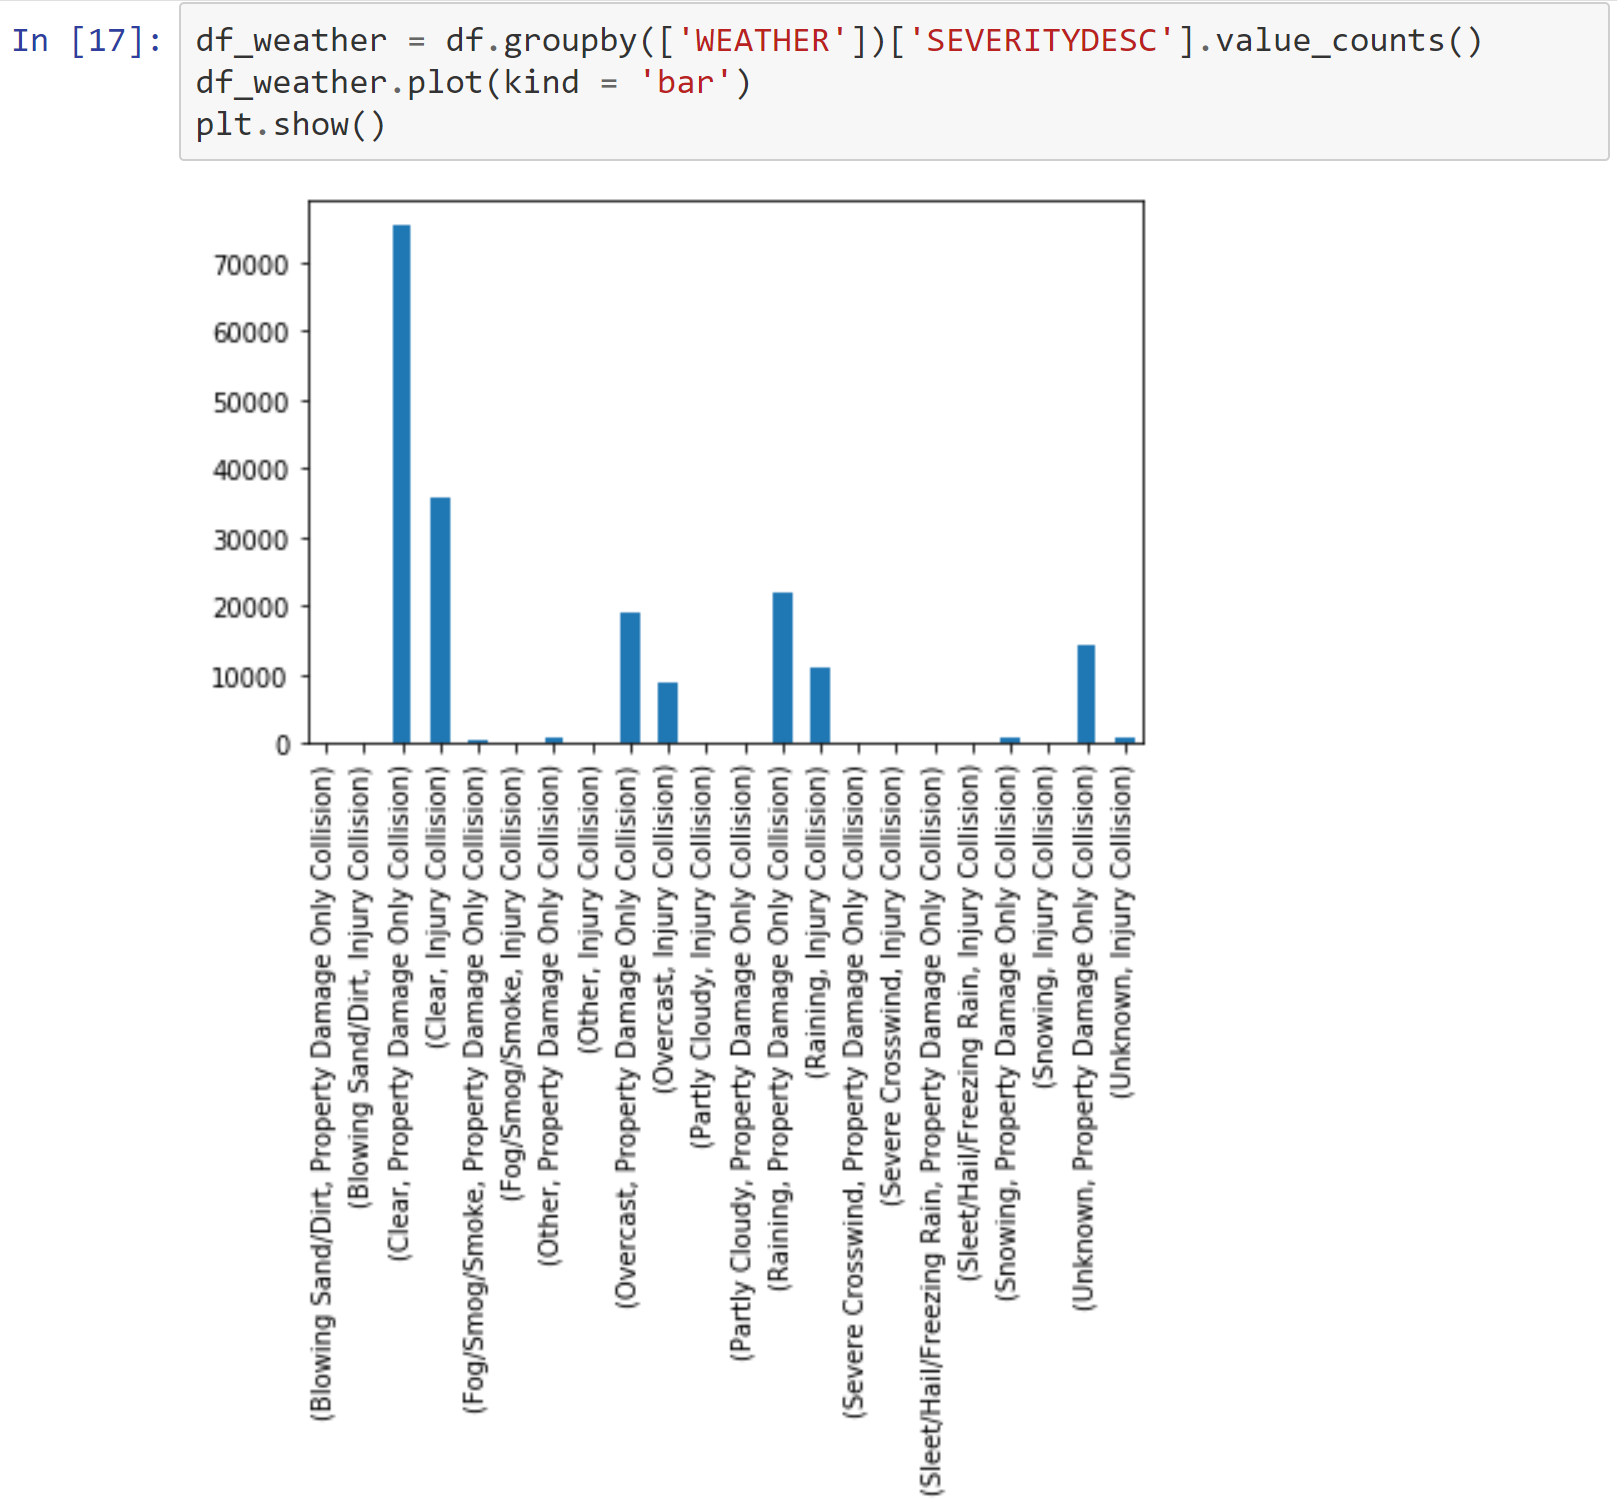
Weather conditions grouped by collision type
Light, road, and weather conditions were all dominated by a couple of results. I made note of this.
I used this data to create train/test splits to train various machine learning models - K-Nearest Neighbors, Support Vector Machines (Kernels - Sigmoid and RBF), a Decision Tree, and Logistic Regression.
After checking the first K-Nearest Neighbors model, I decided to check if there could be any value gained from consolidating some of the data. For example, light conditions had 9 possible results. But, about 85% of all accidents were in either Daylight or Dark - Street Lights On. Instead of leaving 9 results, with essentially a bunch of outliers, I combined all of the others into one option, leaving only 3 lighting options.
I did the same for weather (11 down to 4) and road (9 down to 3) conditions.
I re-ran the KNN model, with somewhat better results.
I calculated various metric scores to determine which model provided the best predictive value
These results were not very promising. None of the models did a very good job of predicting injuries at all.
All told, in the test set, there were 17,018 injury accidents.
In the KNN model, 22 injury accidents were correctly predicted.
In the SVM - Sigmoid model, 1,956 injury accidents were correctly predicted.
SVM - RBF, Decision Tree, and Logistic Regression all predicted 0 injuries. Period. Not even incorrectly! Every single accident was predicted to be property damage only.
Given the imbalanced nature of the data set, it is best to not be misled by the relatively high binary F1 scores of 82+, and rely more on the weighted F1 scores, where SVM - Sigmoid comes in with the highest - a relatively unimpressive 59.97.
In the end, I came to the conclusion that this dataset does not particularly lend itself to predictive accuracy. That does not mean, though, that there is nothing to be learned from the data.
It does appear that there is a higher likelihood of injury when accidents occur in seemingly ideal conditions - daylight, clear weather, and dry roads. Perhaps this is because of a general comfort driving under those conditions.
Maybe when there are poor driving conditions, people are more careful, slower, resulting in higher instances of property damage. At the same time, the numbers are not wildly skewed. Under daylight conditions, an injury accident is a few percentage points more likely than the base rate on all of the accidents surveyed.
There are potential opportunities for further exploration, but those go beyond the scope of this project.


